
See Exactly How Your Learners Move Through Your Courses
A quick heads-up: this one's in Labs
It's an early feature you turn on yourself in Settings > Labs inside your account. It works, but it's still in development - the documentation and support is limited and not everything will behave perfectly yet.
If you like getting your hands on new things early, switch it on and have a play. If you'd rather wait for the finished, fully-supported version, leave it off and we'll let you know when it lands.
You built the course, people signed up, and now you're left guessing. Are they finishing it? Where do they stall? Which people started strong and then vanished?
The rebuilt Course Progress Analytics answers all of that from one dashboard - and it loads a lot faster than the old one, so you're not sitting there waiting for numbers to appear.
Where to find it
Go to Memberships, then Courses, then Analytics, and open Course Progress. That's your new home for everything to do with how people are moving through your material.
Start with the big picture
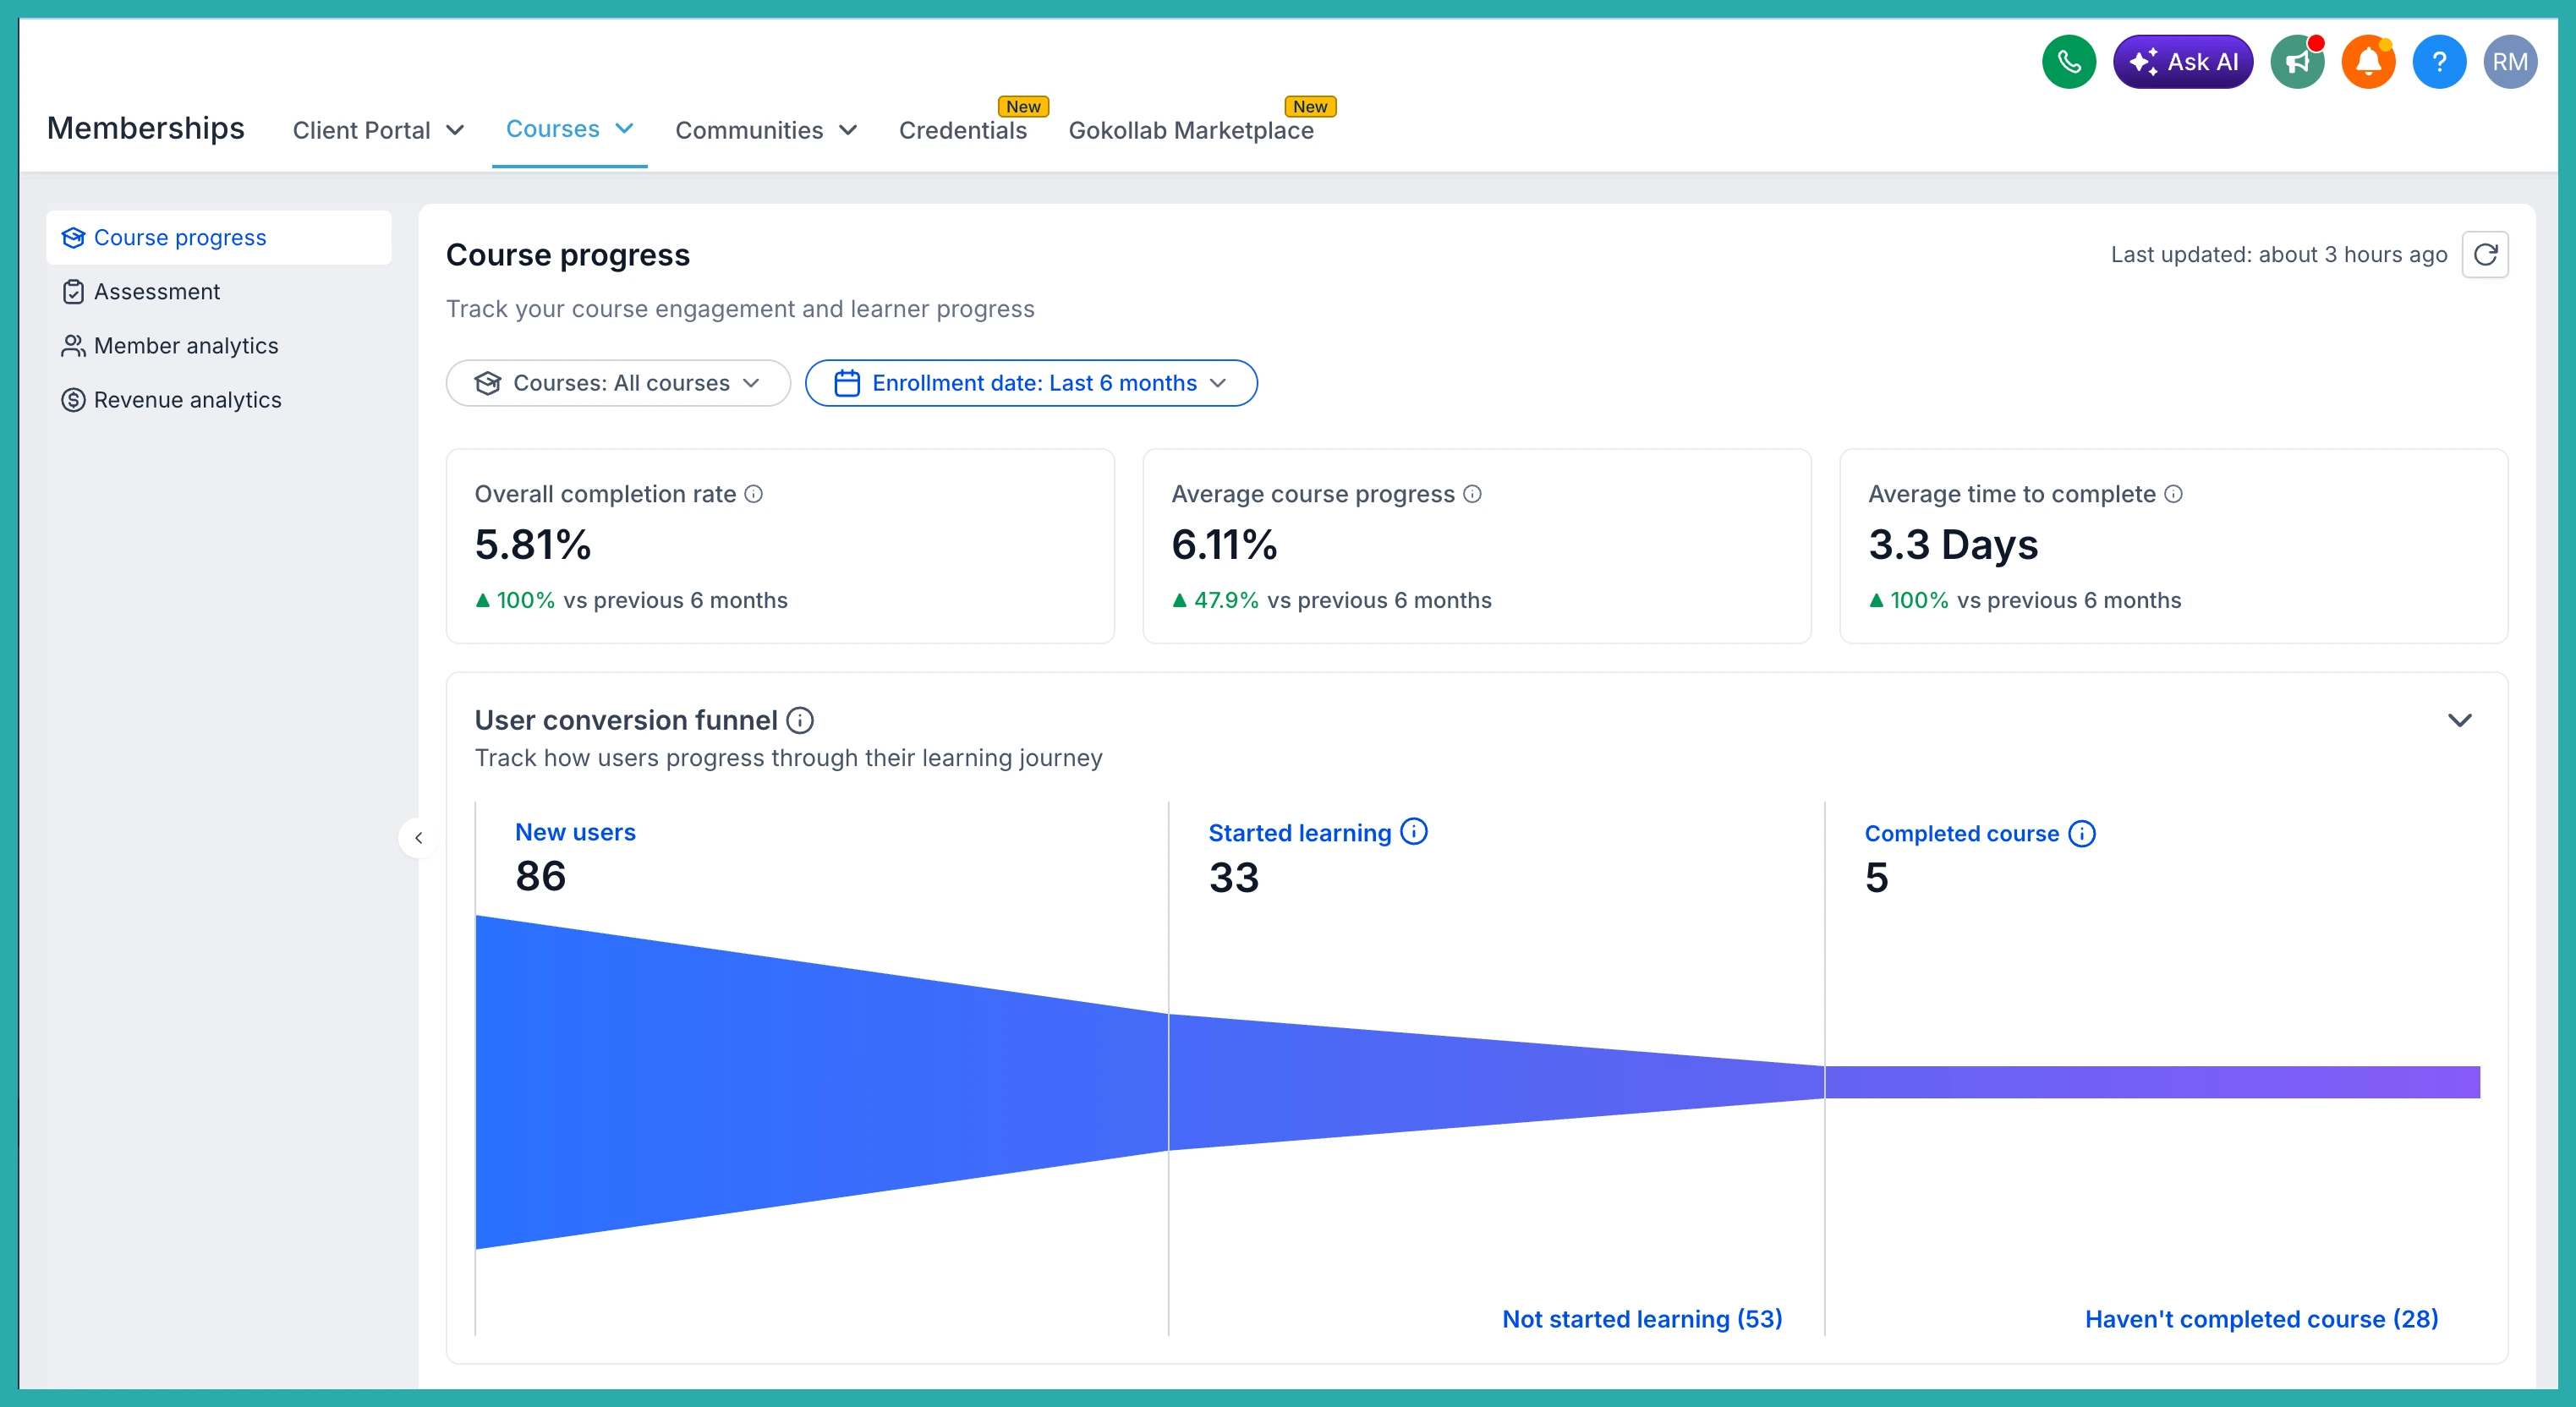
At the top you'll see your key metrics: Completion Rate, Average Progress, and Time to Complete. Each one comes with a period-over-period comparison, so you can tell at a glance whether things are heading in the right direction or slipping.
In the screenshot below, you'll see the main dashboard with those headline numbers laid out.
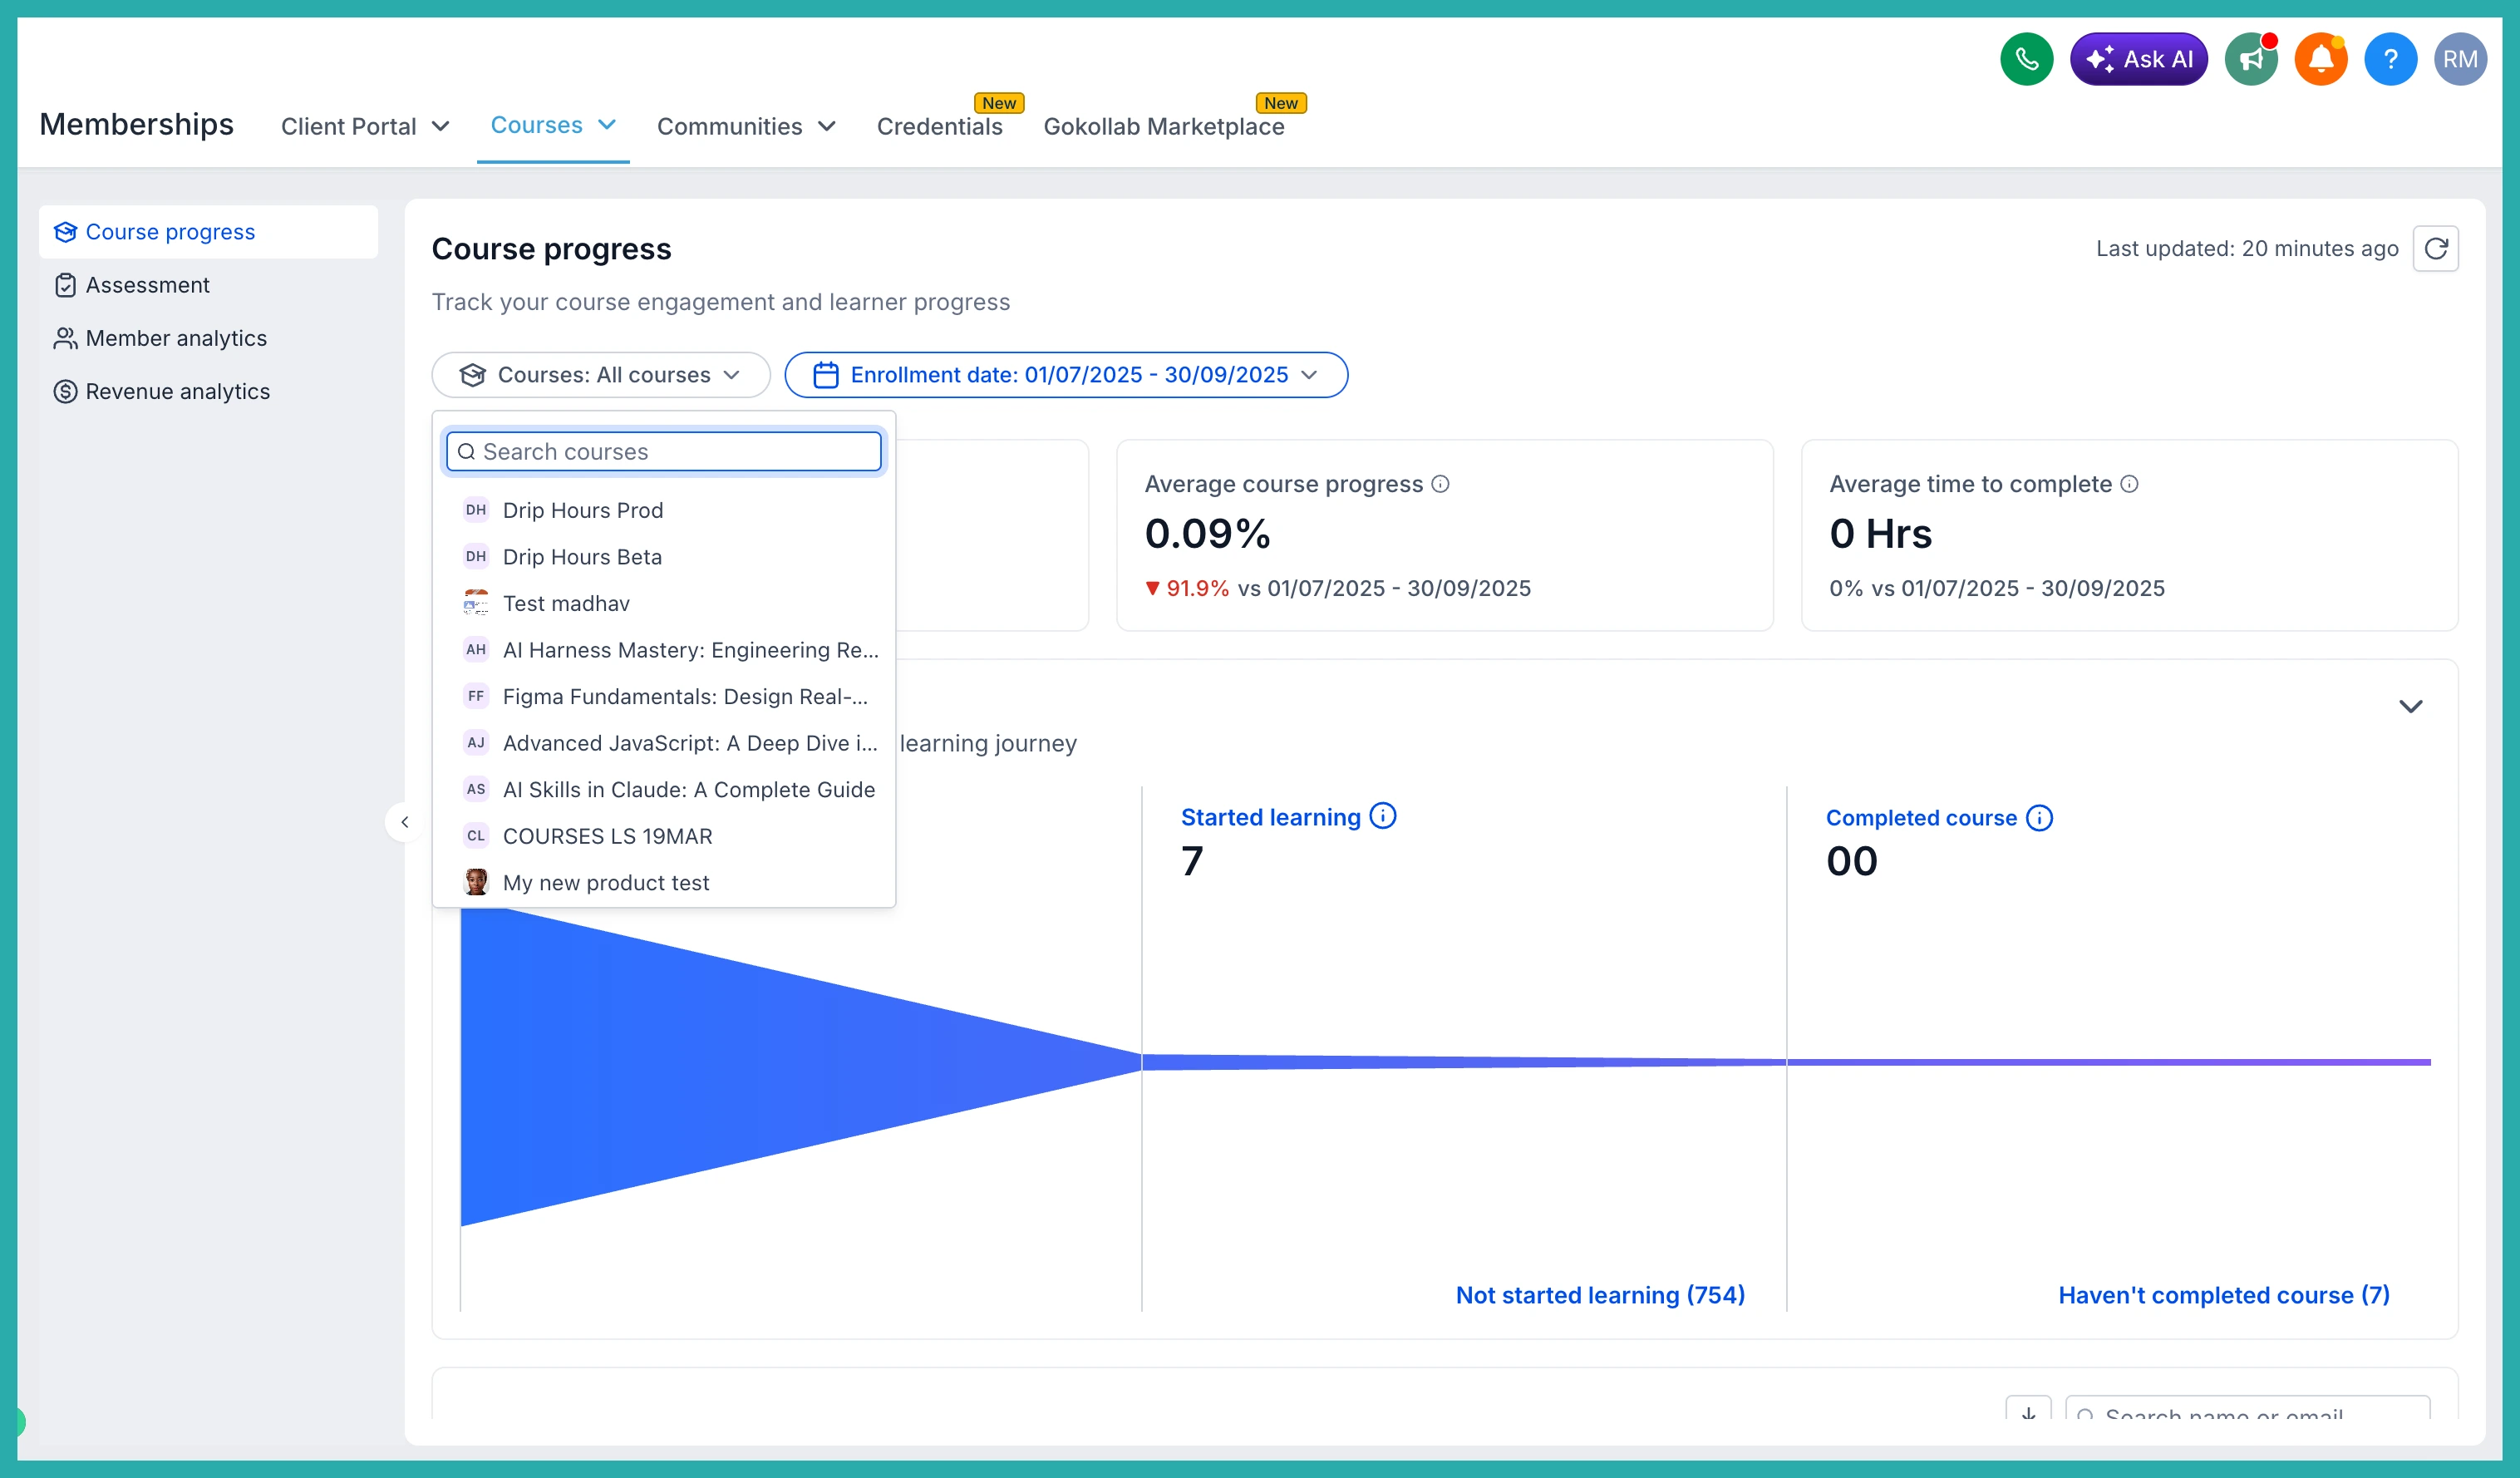
Use the filters at the top to narrow things down. You can filter by Course and by Enrollment Date, which is handy when you want to look at one specific program or check how a recent intake is getting on.
Spot where people drop off
Under the metrics you'll find the Learner Journey Funnel: Enrolled, then Started, then Completed. This is the quickest way to see where you're losing people.
If loads enrolled but only a handful actually started, that's a first-step problem. If plenty started but few finished, the issue is somewhere in the middle of your content.
Drill into individual learners
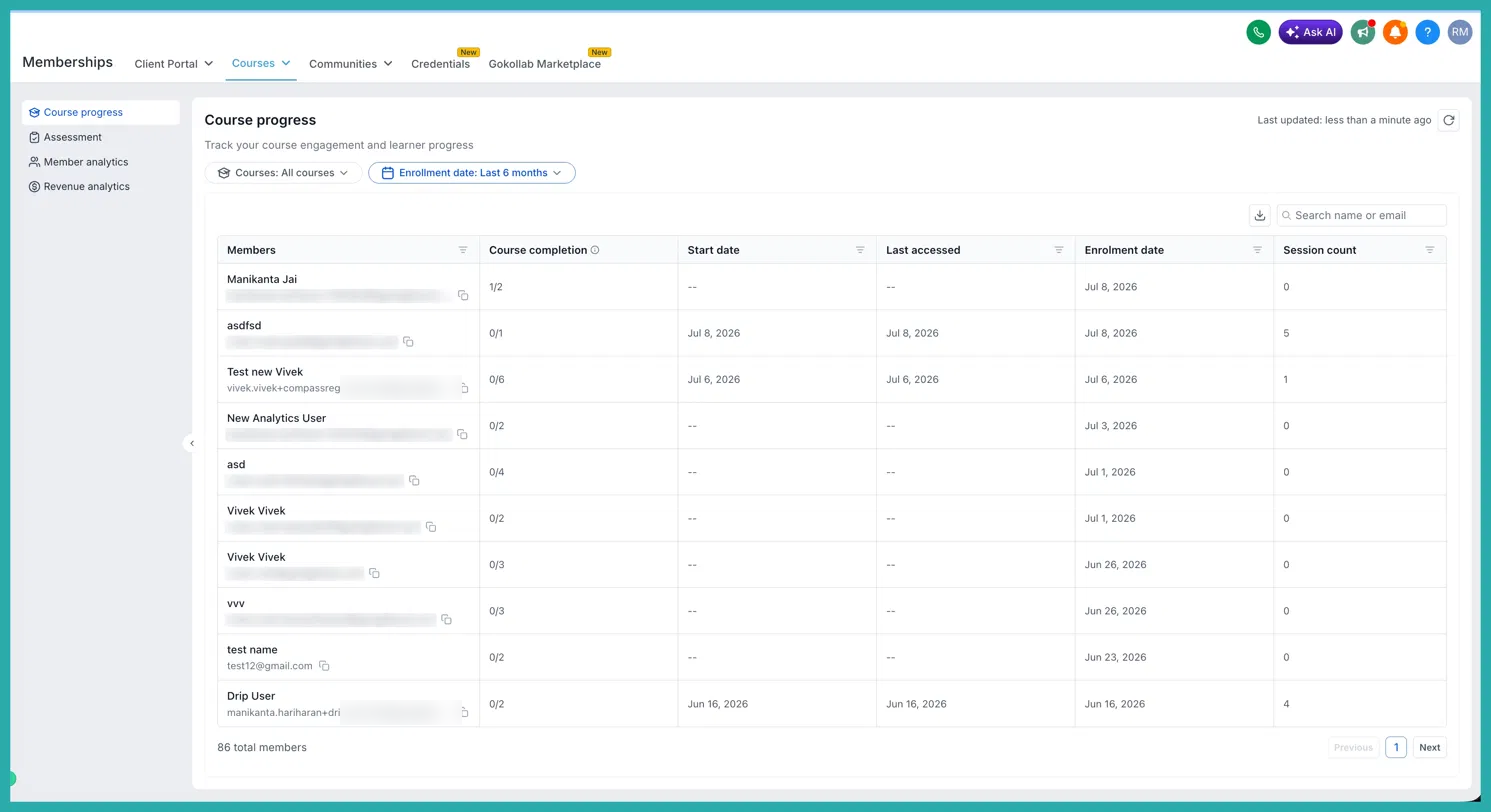
The Member Progress Table gives you the detail - enrollment, activity, completion status, and session information for each person.
This is where you catch the learner who signed up two weeks ago and hasn't touched a lesson since. A quick nudge from you at the right moment can be the difference between someone finishing and someone drifting off.
Export what you need
Once you've filtered your view, you can export it to CSV. Smaller reports download straight away, and for larger ones the system emails the file to you so you're not stuck watching a screen. Useful when you want to hand the numbers to someone else or keep your own records.
What's coming
This is the first piece. Assessment Analytics and Revenue Analytics are on the way to round out the full picture of how your courses are performing.
For now, have a look at your funnel and your member table - you'll probably spot one or two people worth reaching out to today.
