
See How Your Community Is Really Doing With the New Analytics Dashboard
You've been running your community on a gut feeling. Posting, inviting, hoping it's all landing. But when someone asks how it's actually going, you're piecing bits together from different corners of the system.
That guesswork is over. There's now a proper Analytics dashboard built into your community, giving you revenue, membership, traffic and engagement all in one view.
What you get
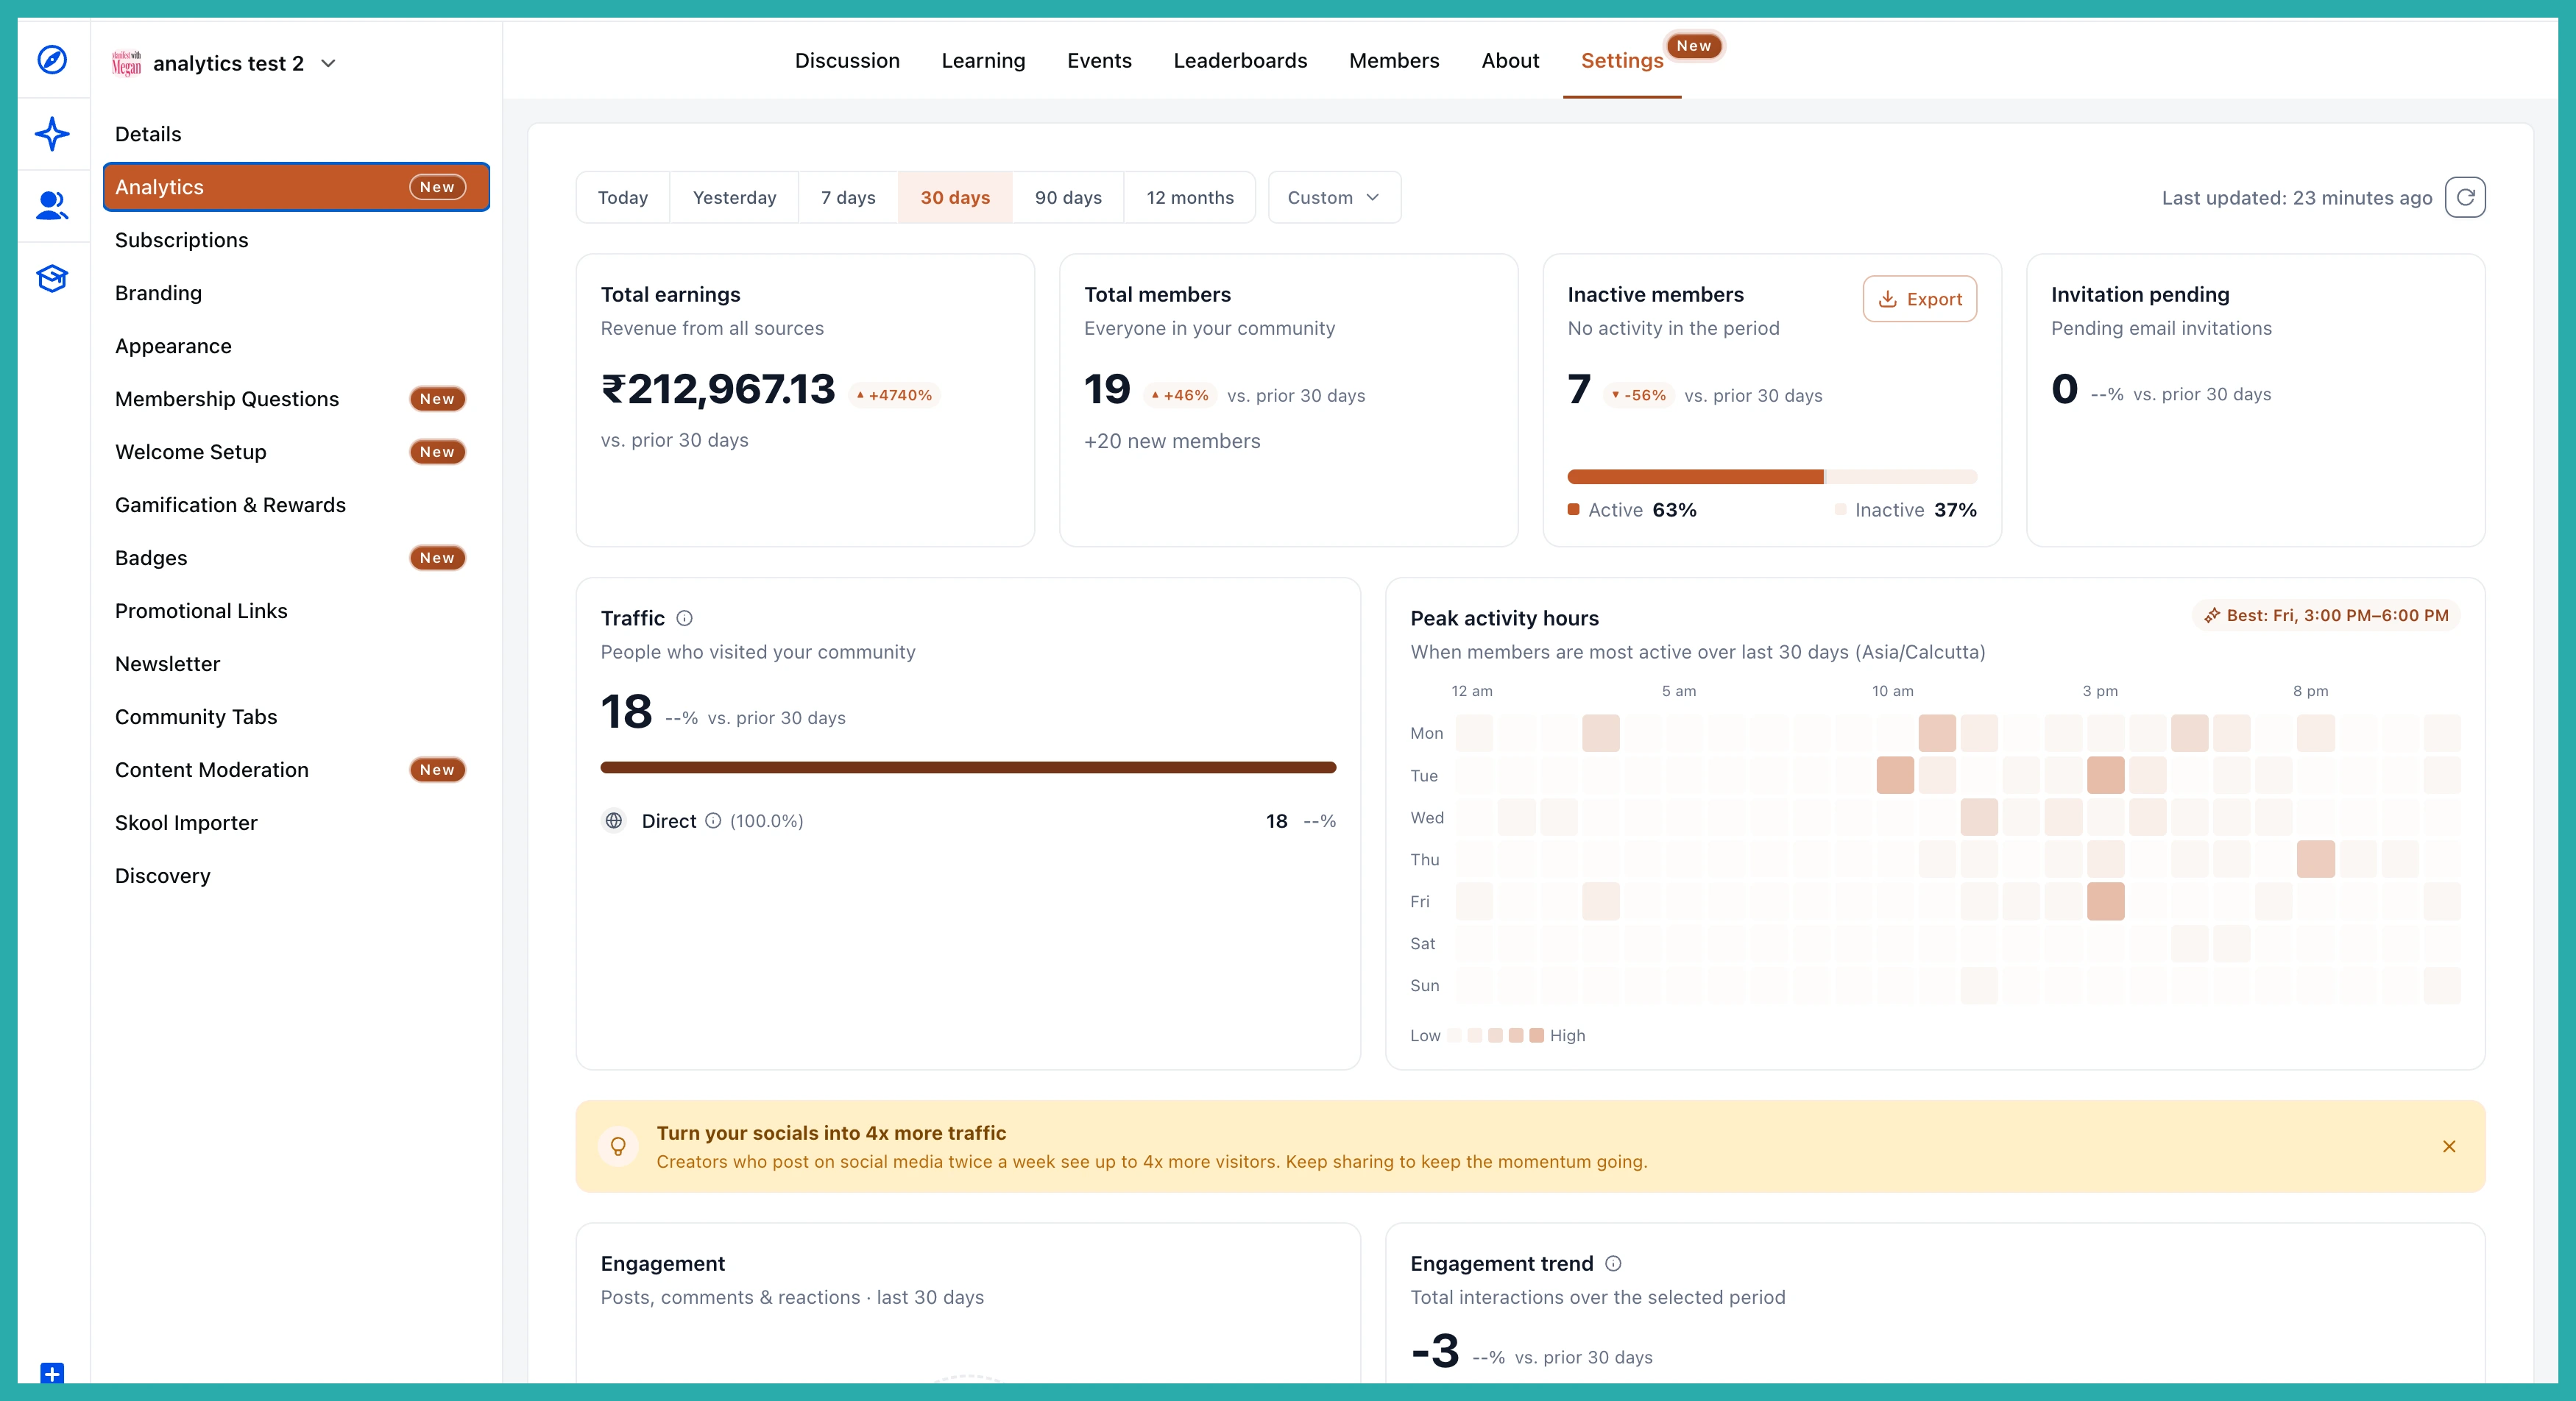
Open your community Settings and you'll find a dedicated Analytics section. At the top, four headline cards give you an instant read on how things are going:
- Total Earnings - your net community revenue, purchases minus refunds and chargebacks, shown in your account's currency.
- Total Members - your current active count, with new joins for the period shown separately.
- Inactive Members - active members who've gone silent in the period, shown as an active-versus-inactive percentage bar. There's an Export button here too, so you can download that list and reach out.
- Invitation Pending - email invites still sitting unanswered.
Each card also shows a percentage change against the previous period of the same length, with an up or down arrow, so you can see the direction of travel at a glance.
Filter the whole thing by date
Up top you've got a date filter: Today, Yesterday, 7 days, 30 days, 90 days, 12 months, or a Custom range. It defaults to the last 30 days, and every card updates to match whatever you pick. One click and the whole dashboard reframes around the window you care about.
See where your members are coming from
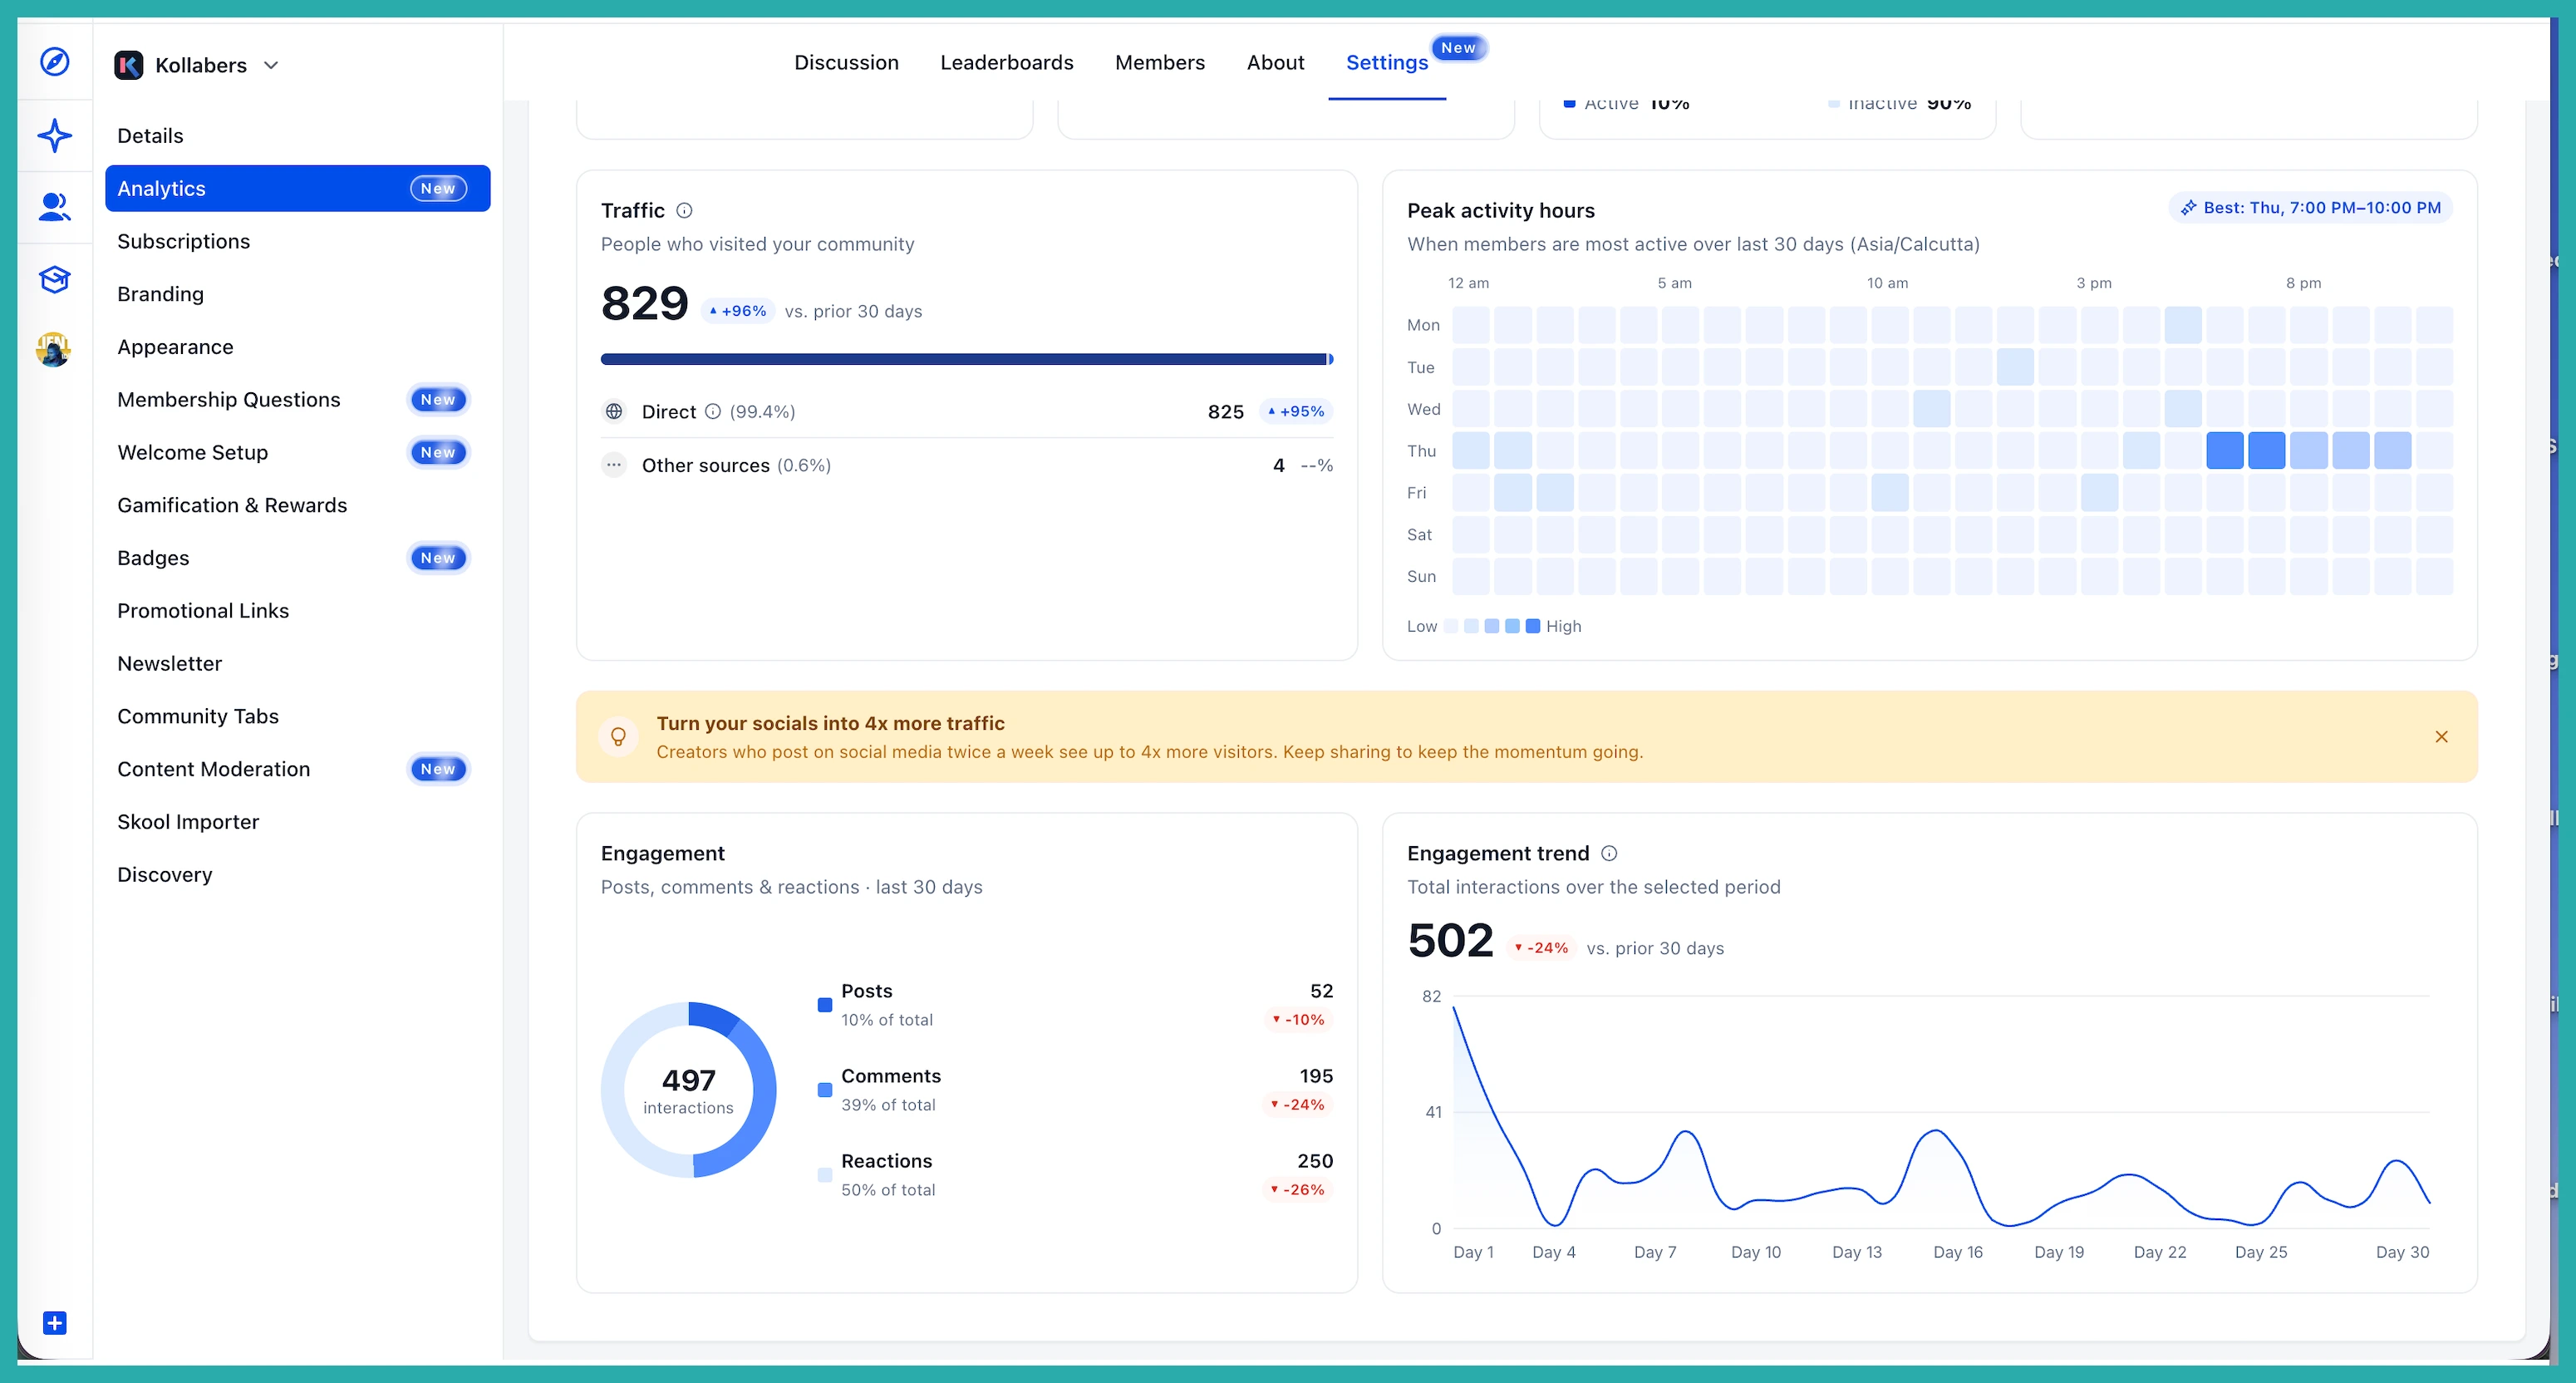
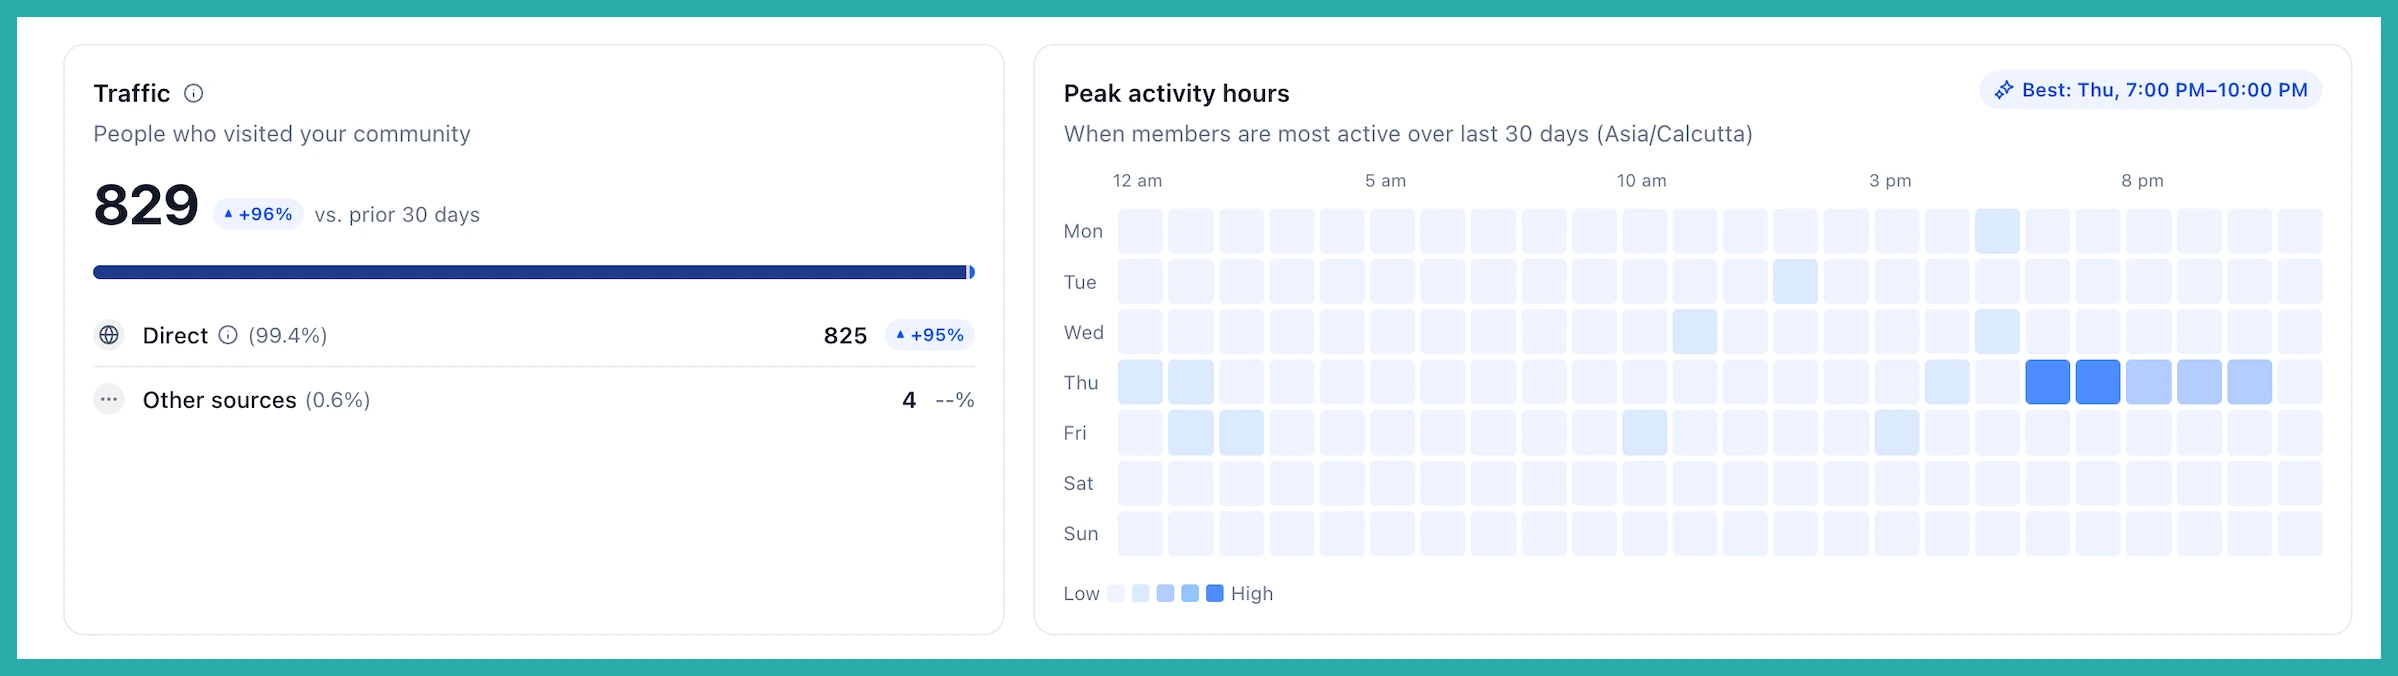
The Traffic Sources section breaks down how people are finding you - Direct, Instagram, YouTube, Facebook, LinkedIn, and Other. Your top sources by volume are named, with the rest rolled into Other, and each one shows its own change for the period.
This is the bit that tells you where to put your effort. If one channel is carrying your growth without you noticing, you'll finally see it in black and white.
Post when your members are actually around
There's a day-by-hour heatmap showing your peak activity hours, in your community's timezone. Darker blocks mean more activity, and your busiest slot gets highlighted for you, something like "Best: Thu, 7:00 PM - 10:00 PM."
Use it to time your posts, events and live sessions for when people are genuinely online instead of guessing.
Track your engagement at a glance
The Engagement section shows a breakdown of Posts, Comments and Reactions as a donut chart, with counts and percentages, and it folds in poll votes and event RSVPs too. Alongside it sits an Engagement Trend line showing total interactions over your chosen period, again with a comparison against the period before.
How to find it
- Go to Settings in your community.
- Click Analytics in the left sidebar.
- Pick a date range from the filter bar at the top.
- Review your metrics, traffic, peak hours and engagement in one place.
- Use the Export button on the Inactive Members card to download a CSV for outreach.
One honest note: traffic tracking starts counting from now, so it fills in as new visits come through. Older traffic isn't backfilled, so give it a little time to build up a picture.
Have a look at your numbers this week. Even five minutes with this dashboard will tell you more about your community than weeks of guessing ever did.
